
Asset Dashboard will open a new window that shows extensive data elements about an Asset. This information is real-time and will be automatically updated.
The Asset Dashboard is a central place to locate pertinent information about an Asset.
General
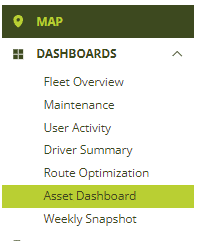
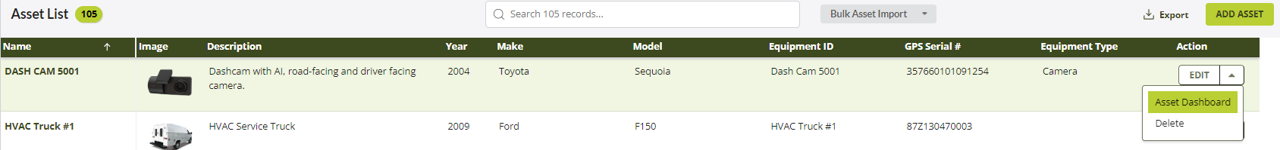
There are four shortcuts to an Asset’s Dashboard.
The Asset Dashboard is comprised of the following sections, arranged as tabs at the top:
- Dashboard
- Analytics
- Machine Hours
- Alerts
- Maintenance
- Inspections
- Driver
- Documents
Asset Dashboard Tabs
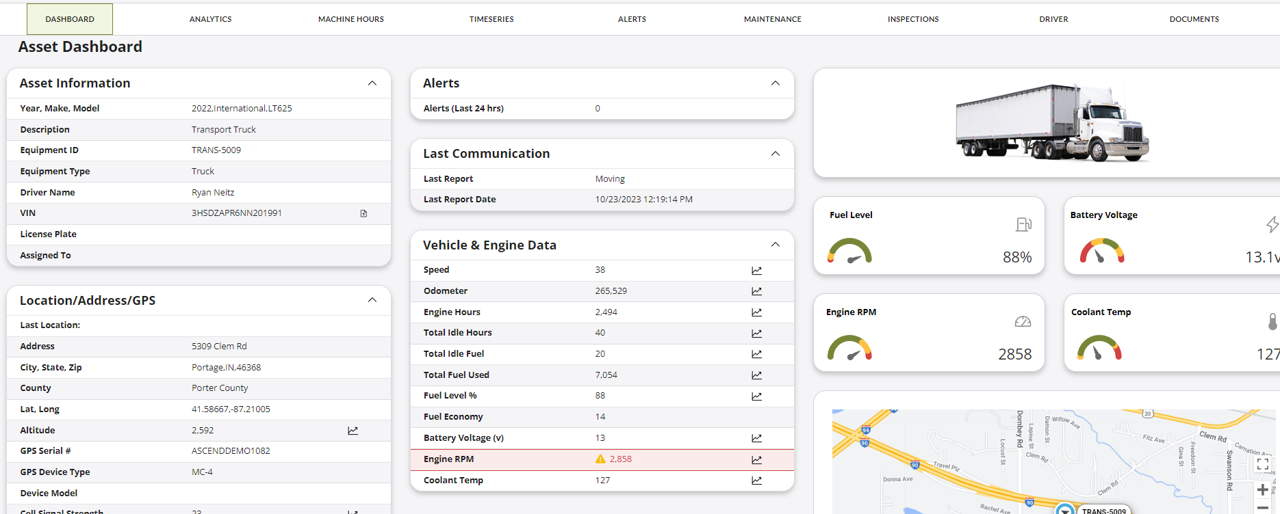
Dashboard
The Dashboard section is primarily comprised of a set of customizable data fields. Visit our Customize Views page for a complete list of data elements that can be listed in the Dashboard section of the Asset Dashboard. Data in this section reflect the last known values and are typically updated near real-time.
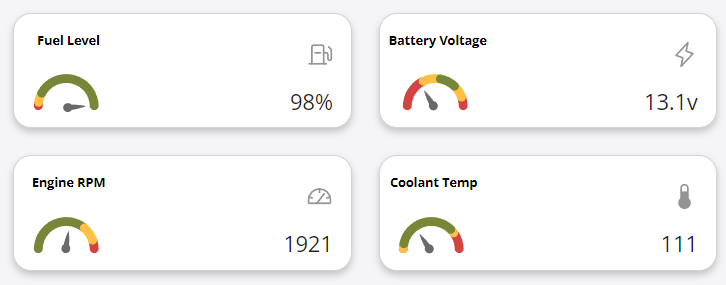
Engine Gauges
Engine gauges like the Fuel Level and Coolant Temperature gauges are located above the Map View.
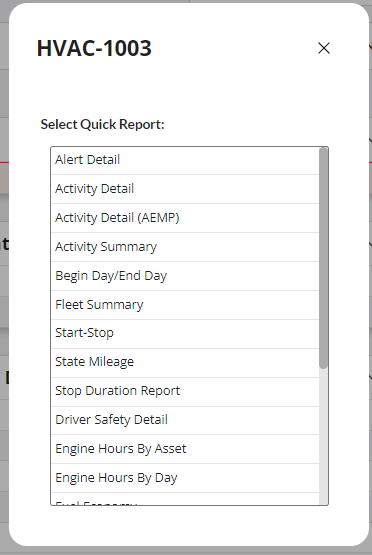
Run a Quick Report
In the upper right-hand corner of the Dashboard section, users can run a Quick Report by clicking the Select Quick Report dropdown menu and selecting a Report Type.
The timeframe for the report will be the current day when in the Dashboard view, but the timeframe can be modified from the Analytics, Alerts, or Documents section.
Print the Asset Dashboard
To print any section of the Asset Dashboard, click the Print Icon. The Print Icon is located in the top right part of the Asset Dashboard.
Asset Location-On-Map
The map in this Dashboard displays the last known location of the Asset. If the Asset is in a Location, the Location will also be shown on the map. You can hide Locations from the map view by clicking the Hide Locations button under the map in the Asset Dashboard.

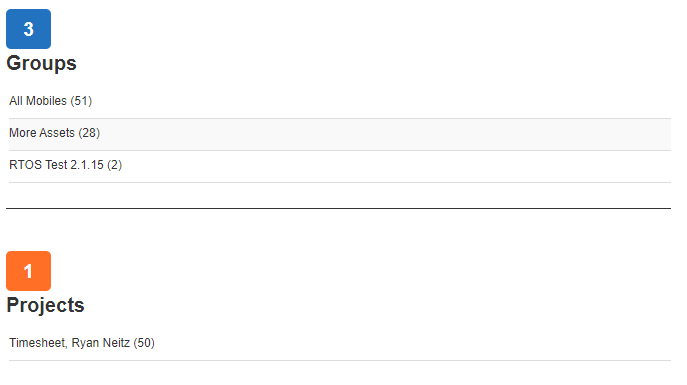
Group and Project Assignments
Any Group or Project assignments from the current hierarchy account will be shown in the bottom right corner.
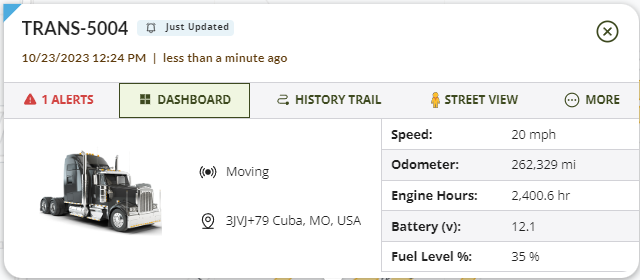
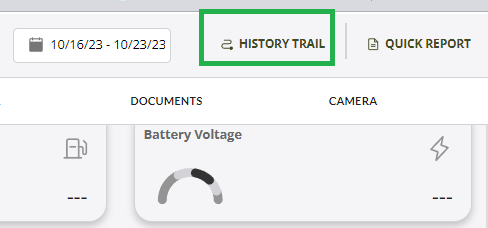
Shortcut to the Asset’s History Trail
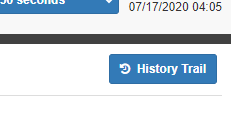
History Trail
Click on the History Trail button in the top right section of the Asset Dashboard to view a history of the Asset’s movement.
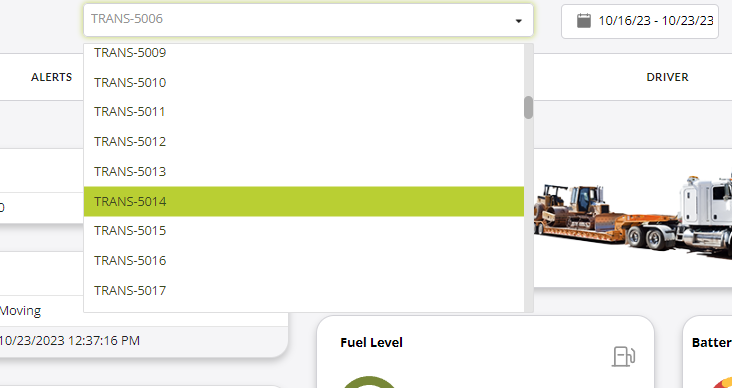
Shortcut to Another Asset Dashboard
Use the dropdown menu to the right of the Temeda logo to switch between Assets.
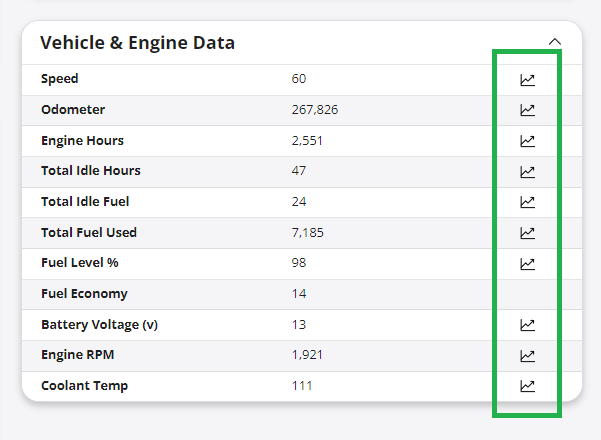
Data Field History
Most data in the dashboard has an associated 7-day history graph, accessible through a “graph” icon in the data row.
The timeframe can be adjusted using the date picker, and additional data field graphs can also be added to the page.
This feature allows you to quickly drill into a specific field and see what data is being transmitted from the telematics device, without running a separate report. This can be a useful tool to analyze time-series data from your devices in a graphical chart.
Switch between assets in the Data Field History page by using the Asset dropdown, and the charts will refresh to show data for the new Asset. Each chart can also be toggled between “Raw Data” and “Avg/Min/Max”.
Export data from each chart as an Excel spreadsheet by clicking “Export Data”, at the top of each chart.
Analytics
This section graphically displays analytical data over a customizable timeframe.
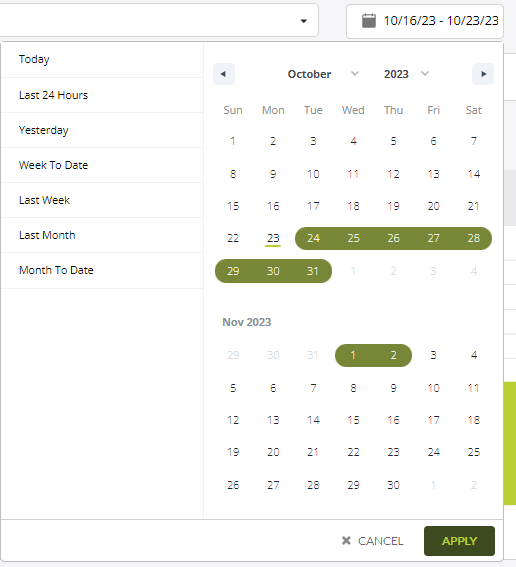
Choose the Date Range
Update the timeframe in the graphs using the date filter in the top right corner of the Analytics section.
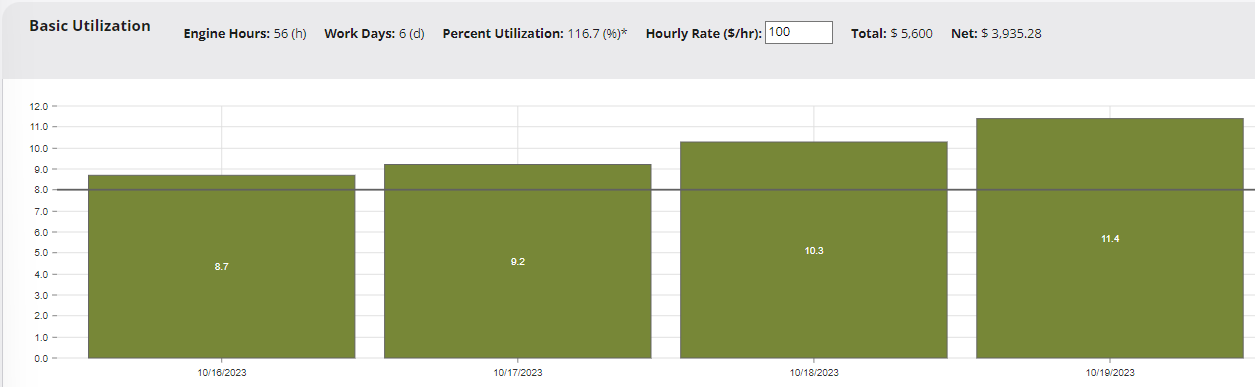
Basic Utilization
The Basic Utilization graph breaks down the total runtime for each day in the date range. The overall engine runtime and utilization rate for the date range are listed along the top of this graph. The Utilization Rate is calculated using the following equation:
Total Runtime / Capacity = Utilization Rate
Capacity is determined by multiplying the number of business days in the date range by eight hours.
A simple estimate of gross revenue and net profit is shown on the right above the utilization graphs. You can set an Asset’s hourly rate in the Asset Detail Form or adjust it in the Asset Dashboard. The estimate for Net Revenue requires that the cost of fuel be set in the Fuel Usage chart directly below the Basic Utilization chart. The estimate of Net Revenue is calculated using the following equation:
Hourly rate x Total Engine Hours – Cost of Fuel = Net Revenue Estimate
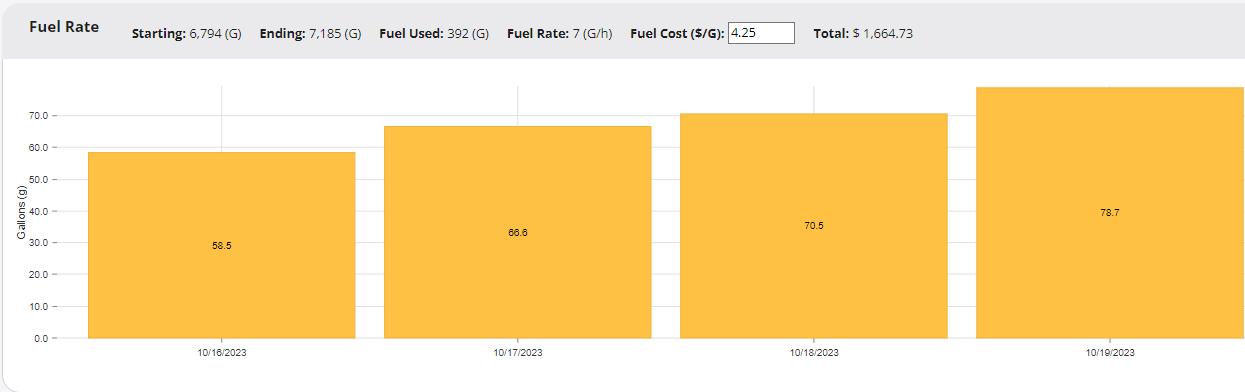
Fuel Usage
The Fuel Usage chart displays the following Fuel related metrics.
- Daily Fuel Totals
- Total Fuel for the Date Range
- Total Fuel Cost for the Date Range
- Fuel Rate
- The Total Fuel Used for the Lifetime of the Engine at the Start of the Date range
- The Total Fuel Used for the Lifetime of the Engine at the End of the Date range
Adjust the average cost of fuel for the date range by modifying the value in on the right side, above the chart.
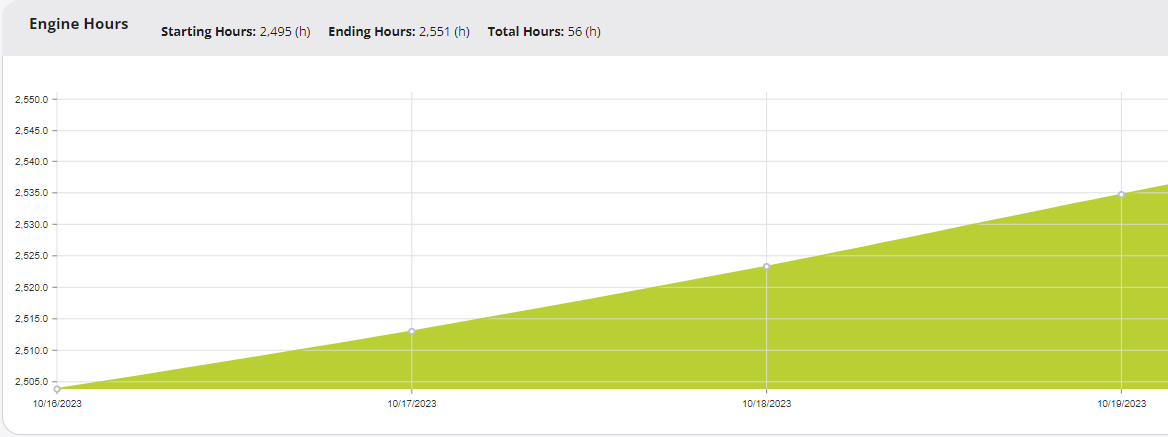
Engine Hours
The Engine Hours chart shows the Lifetime Cumulative Engine Hours for the selected date range.
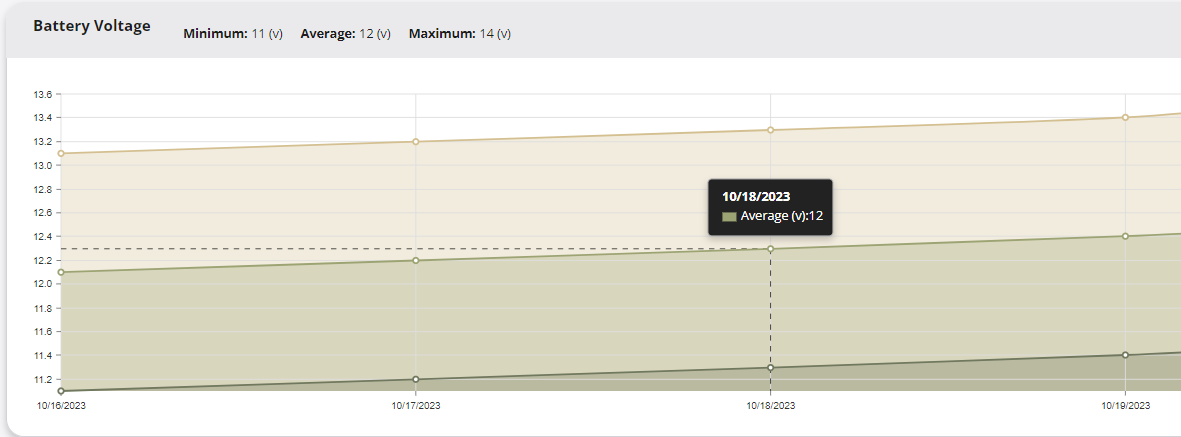
Battery Voltage
The Battery Voltage chart displays the daily average for the Asset’s battery so you can spot dying batteries before you experience equipment downtime.
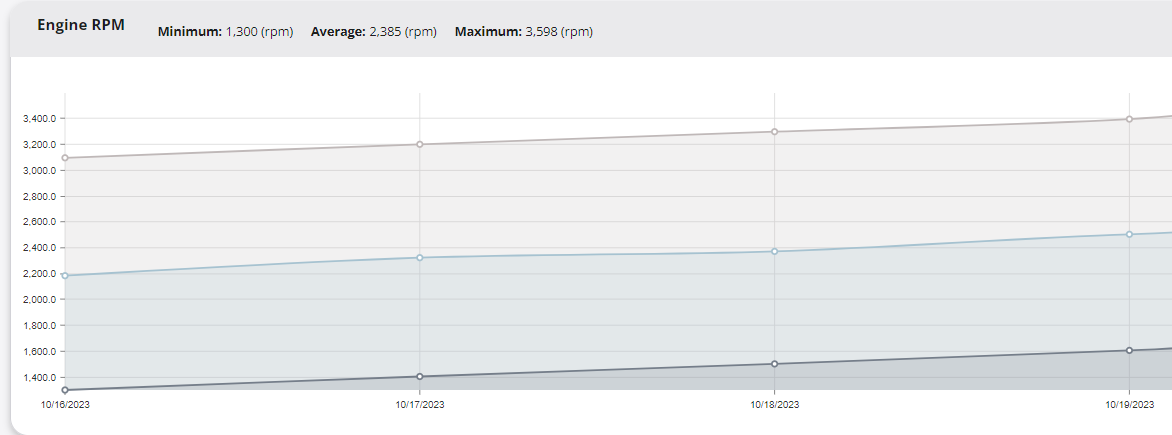
Engine RPM
The Engine RPM chart displays RPM data, including each day’s maximum RPM and the max for the date range. This chart makes it easy to find days when the engine may have been working too hard.
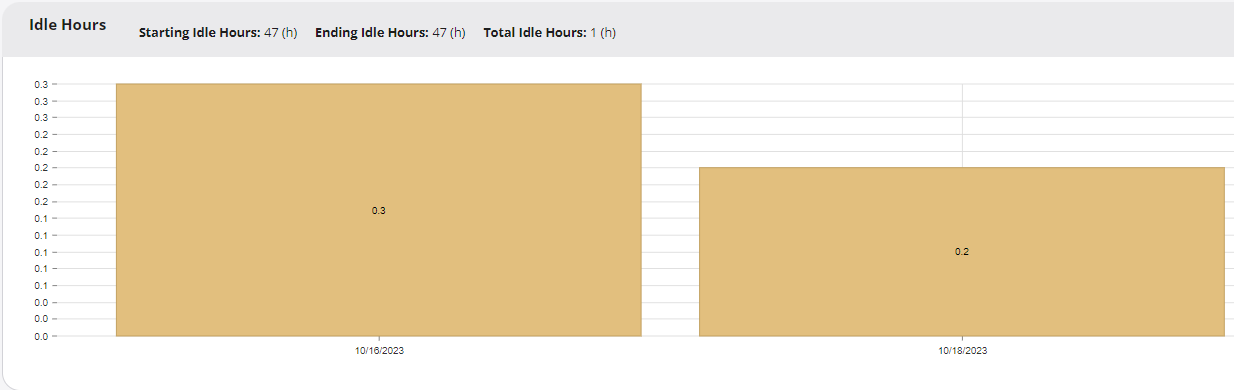
Idle Hours
The Idle Hours chart uses the Idle Hours reported from the ECU to display daily idle times. This chart is valuable for spotting trends in increasing or decreasing idle times.
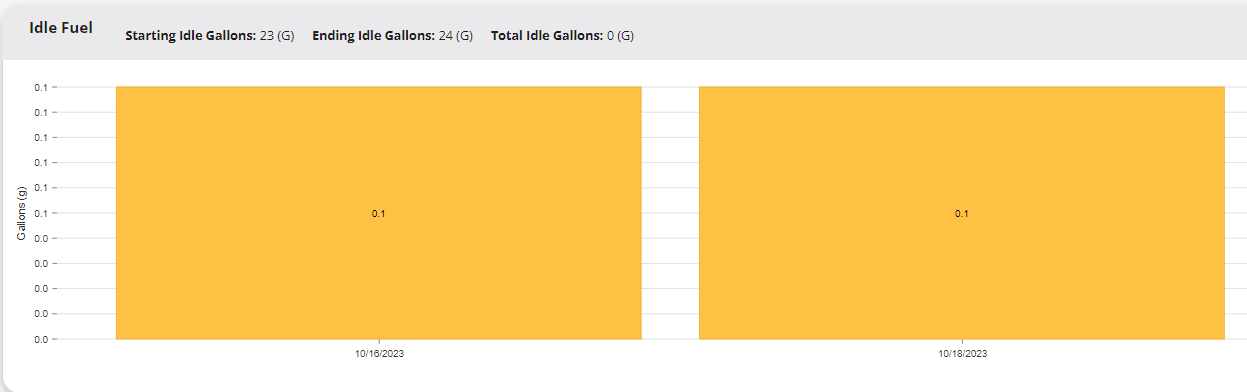
Idle Fuel
The Idle Fuel chart uses the Idle Fuel reported from the ECU to display daily idle fuel totals. The total cost of the fuel used by idling is on the right above the chart. Adjust the average cost of fuel for the date range by modifying the value in on the right side above the Fuel Usage chart.
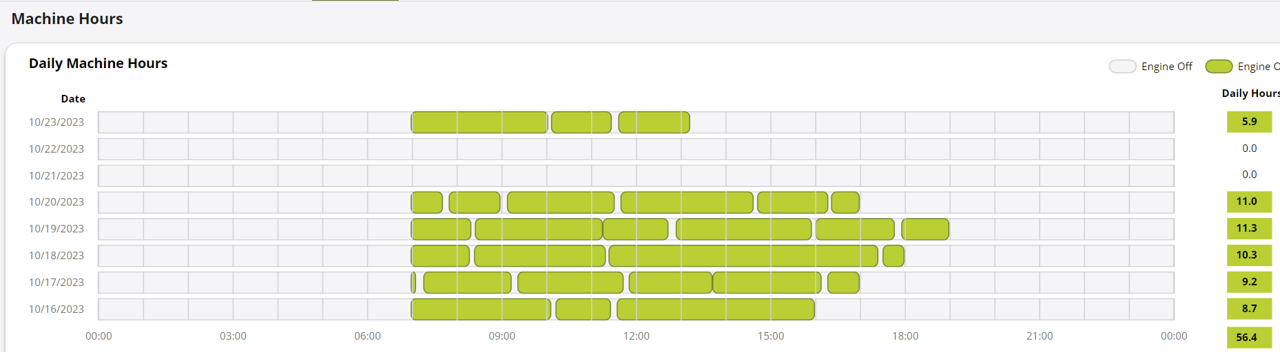
Machine Hours
The Machine Hours tab provides a graphical representation of your Asset’s engine hours – from ignition on to ignition off – in a day-by-day, 24-hour calendar matrix display.
Data can be filtered by date, and the right column provides daily engine hour totals, as well as a grand total for the selected period.
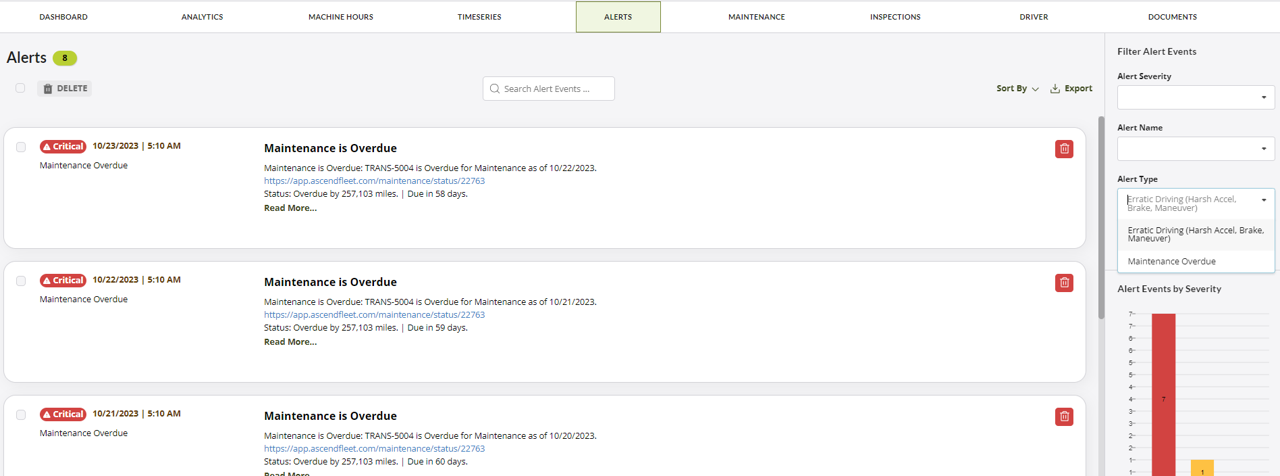
Alerts
The Alert section displays detailed information about all of the Alerts for the selected Asset.
Choose the Date Range
Update the timeframe in the graphs using the date filter in the top right corner of the Alerts section of the Asset Dashboard.
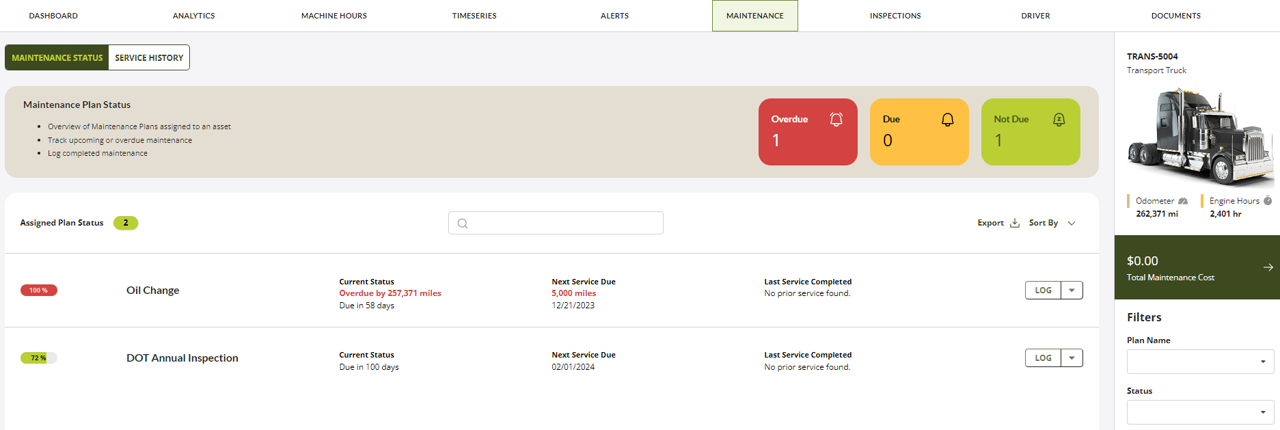
Maintenance
The Maintenance section of the Asset Dashboard displays the entire work order history for an Asset, as well as any upcoming or overdue maintenance.
Maintenance Status
Review the status of maintenance, such as how long until maintenance is due and the tasks involved in the maintenance. This section also has a shortcut to log maintenance performed.
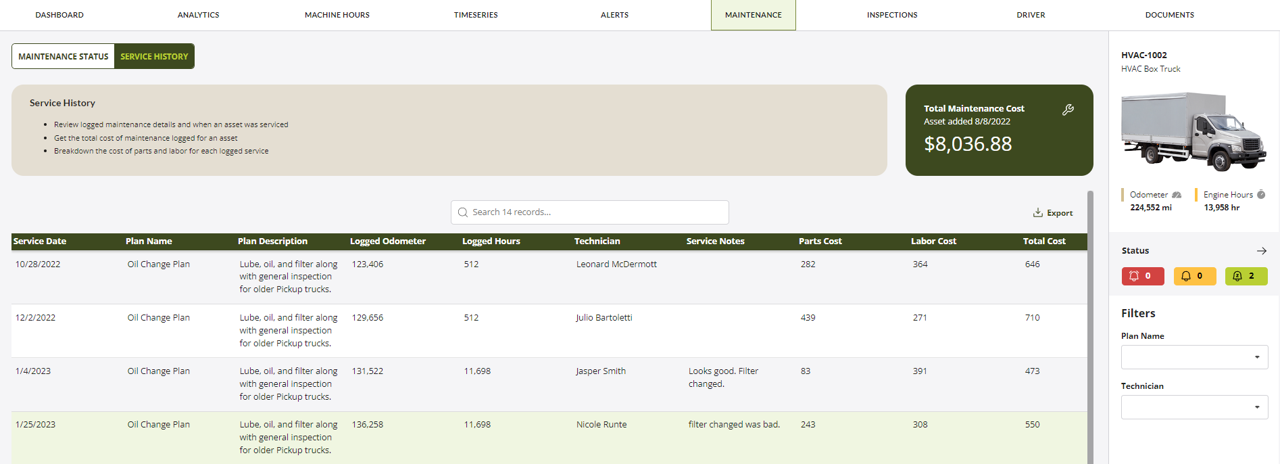
Maintenance History
Review the history of Maintenance Logs, including tasks completed, date of completion, and the total cost of maintenance.
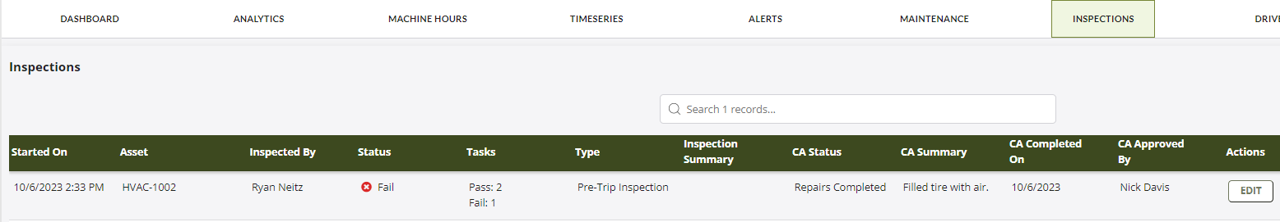
Inspections
The Inspections section displays a list of all inspections and their status, including any corrective actions taken. The date range can be adjusted in the top right corner.
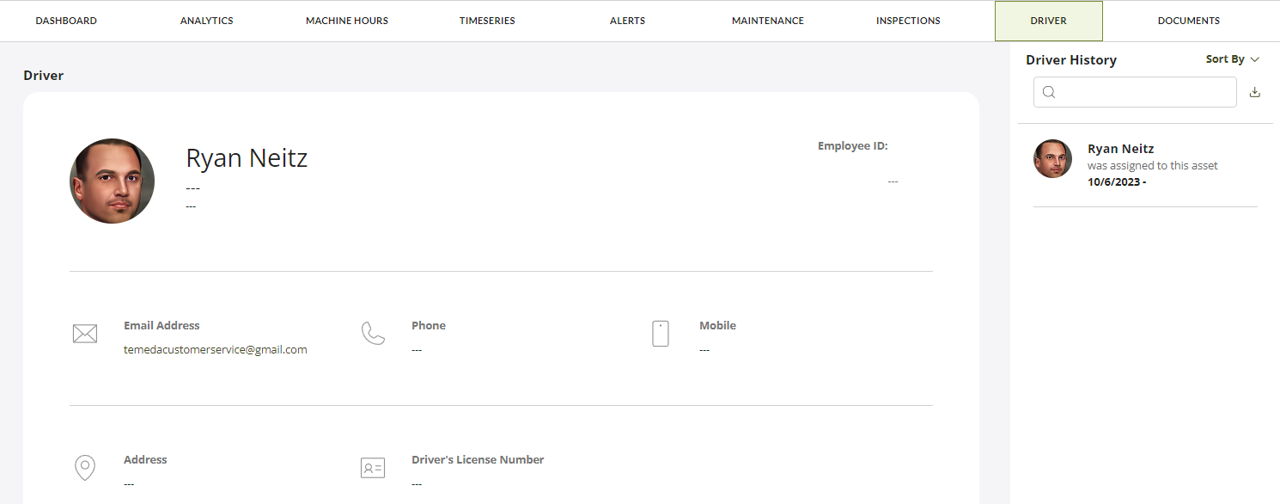
Driver
This section shows you the history of all Drivers/operators on a particular asset or vehicle. This helps you keep track of who operated which vehicle and when.
Documents
This section allows you to attach documents, such as registration forms or permits related to the Asset. You can attach an assortment of file types to the Asset in the Asset Detail form. Visit the help section for Assets to learn how to add a file related to the Asset.
Customizing the Asset Dashboard
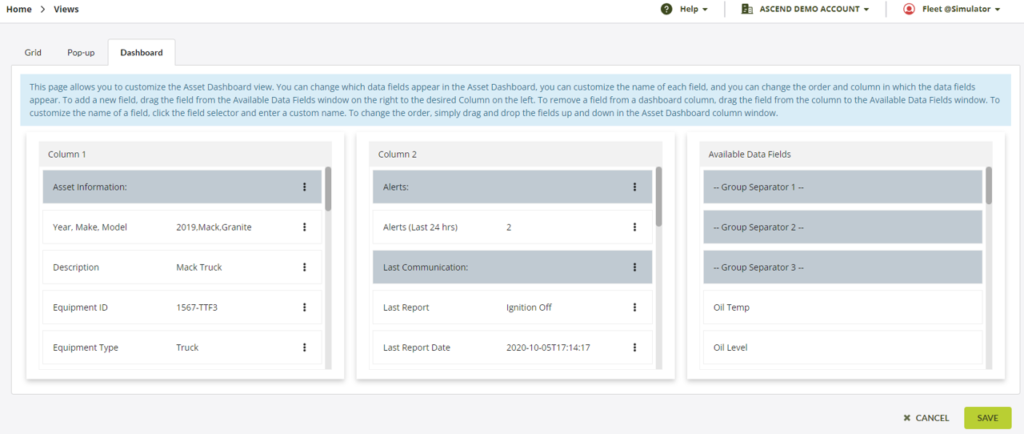
Group Separators
Use Group Separators to organize your asset’s information.
- Left-click and drag a Group Separator above the data fields you’d like to group together.
- Reorder the data as you like (below).
- Click Save
Reorder data
- Left-click and drag any data field to its new location
- Click Save
Add a new data field
- Find a field in Available Data Fields
- Left-click and drag any data field to its new location
- Click Save
Edit the data field’s name
- Click the triple dot icon by the data field
- Add the new name and click Apply
- Click Save
Remove a data field
- Left-click and drag any data field out of the Asset Pop-up column
- Click Save