
There are a variety of different reports you can run on your fleet’s data.
All reports offered are listed below.
Alerts
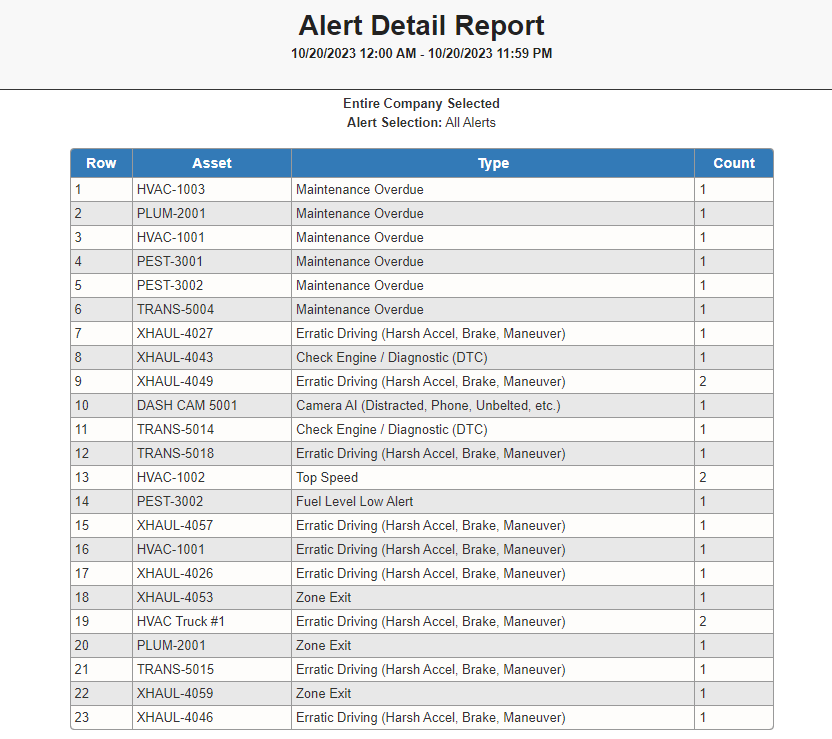
Alert Detail
All the alerts that occurred in the date range.
The alert subject, message and date/time are displayed as well as the location/address if applicable. There is a summary of alert counts at the top of the page.
Asset Activity & Movement
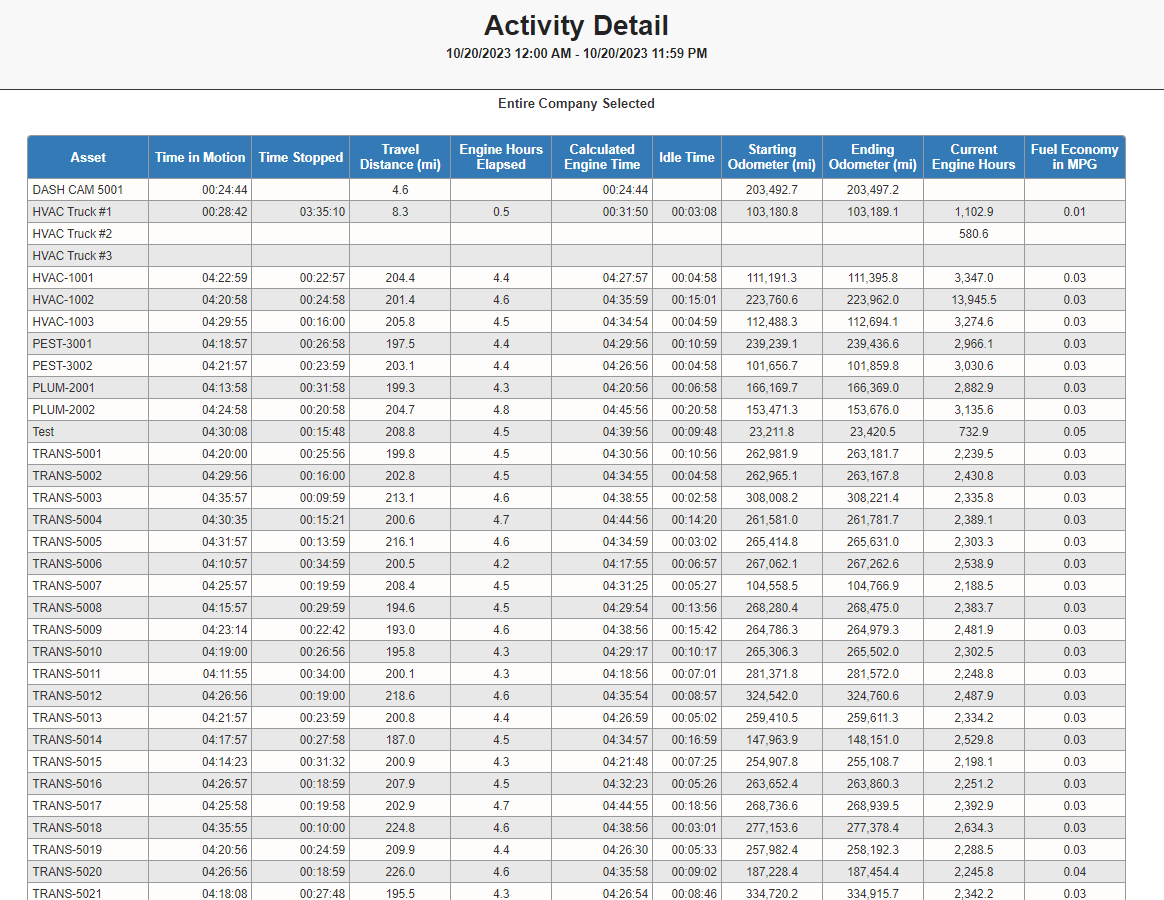
Activity Detail
The events that occurred for the Assets in the selected date range.
It also summarizes the distance traveled, time in motion, and other important information about the assets in a table at the top of the report.
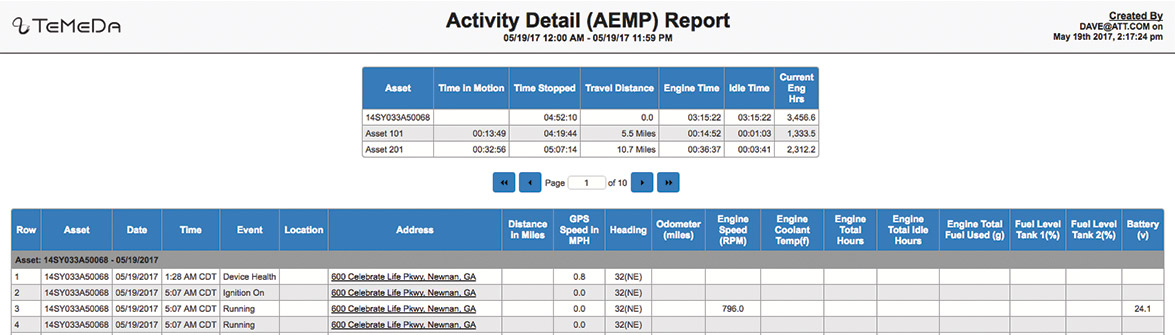
Activity Detail (AEMP)
Displays information detailed in the AEMP specification.
Like the Activity Detail report, a summary table at the top will show total engine time and distance information about your assets.
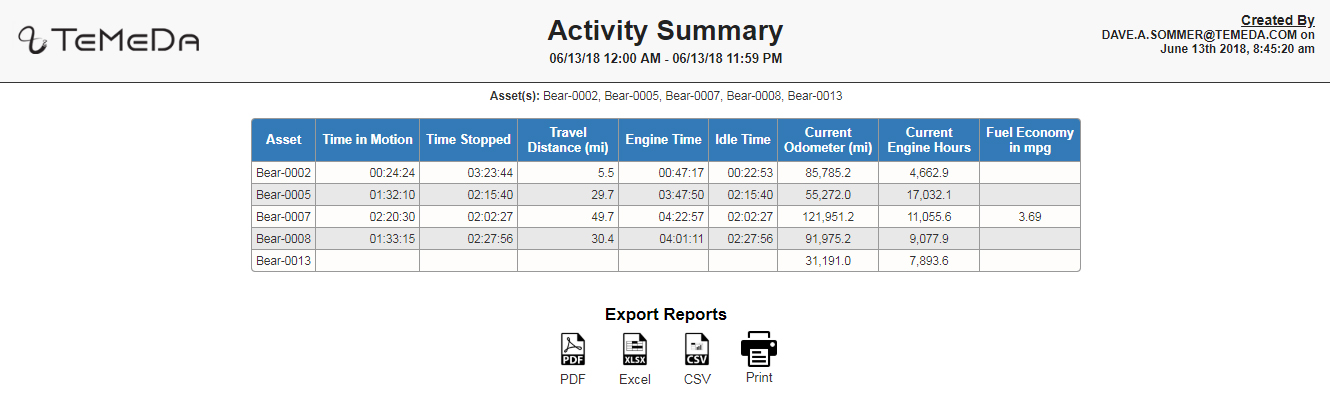
Activity Summary
Summarizes the distance traveled, time in motion, time stopped, engine time, idle time and other important information about your assets without the details that make up each trip.
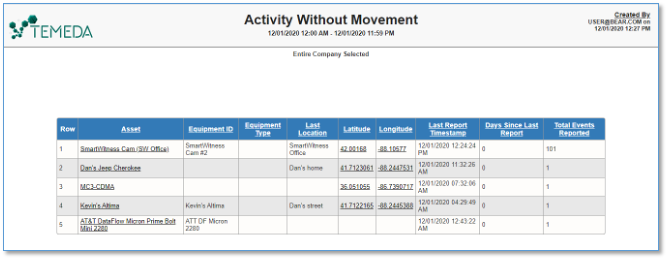
Activity Without Movement
Lists healthy Assets that are actively communicating but have had no motion (have not moved) during the date range you select. This report is a great way to find dormant equipment within your fleet – an easy way to find out which equipment is sitting around at job sites or out in the field but just not being used.
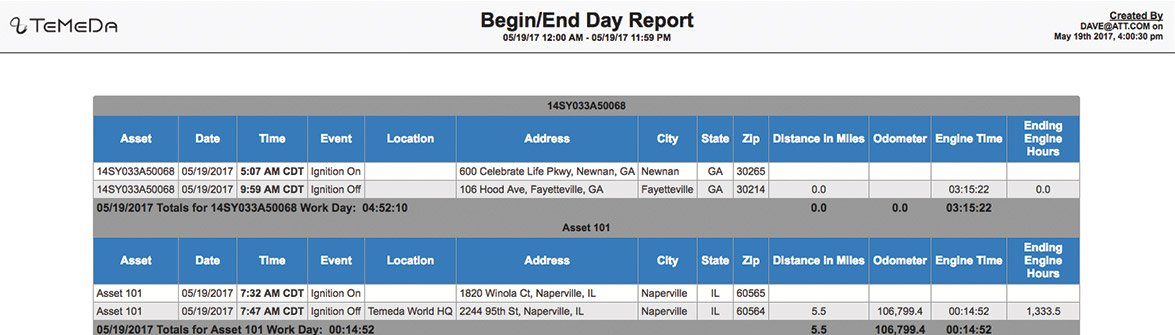
Begin/End Day
Shows the first ignition on and last ignition off of each day in the date range.
The ‘Work Day’ time listed is the total time between the two events. The total distance, engine time and final odometer of the day are also listed in the table.

Fleet Summary
Shows summaries of engine/travel/idle time, as well as total distance traveled and total stops over the date range.
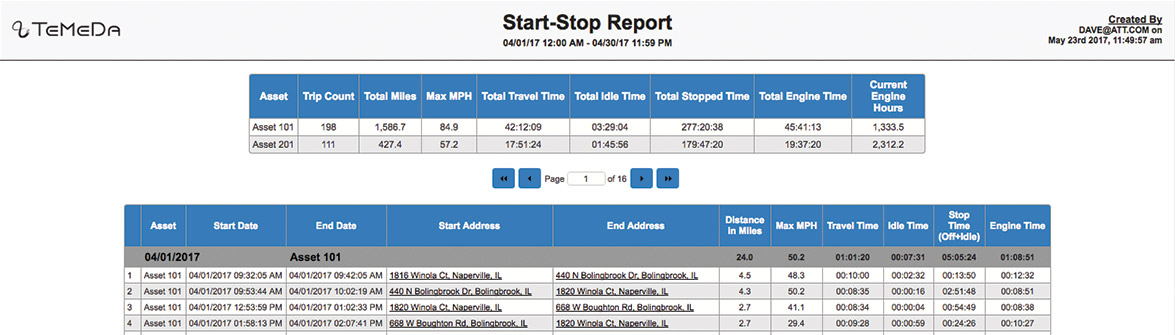
Start-Stop
Shows information about trips during the specified date range.
Includes distance traveled, motion time, starting point, ending point start and end time and other information about the trip. A summary table at the top will show totals by asset.
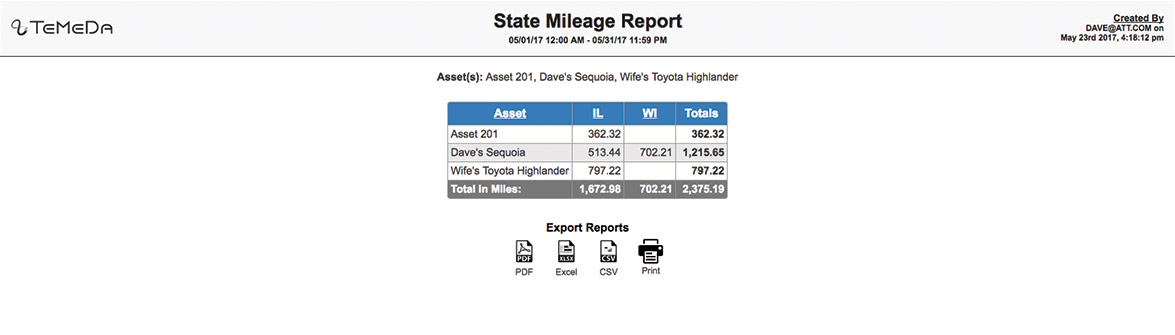
State Mileage
Shows the total distance summarized by state and asset in a cross-tab format.
Stop Duration Report
Shows the events that occurred for the Assets and date range you selected.
Calculates the number of stops, and color codes/highlights stops into 3 levels based on the length of the stop.
Also summarizes the distance traveled, time in motion and other important information about your assets in a table at the top of the report.
Driver Safety
Driver Safety Scorecard
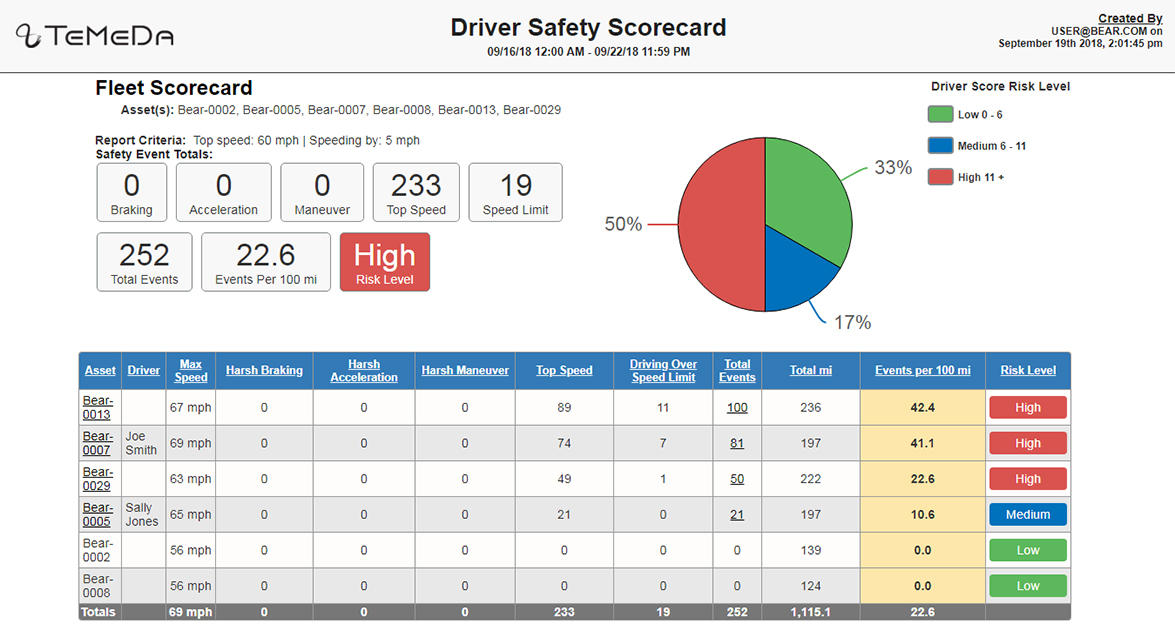
Shows your Fleet Safety Scorecard for your entire fleet, along with the scores of each driver.
You can adjust the top speed threshold for speeding events, and the report will total harsh accelerations, braking, and harsh maneuver events.
Driver Safety Scorecard Detail
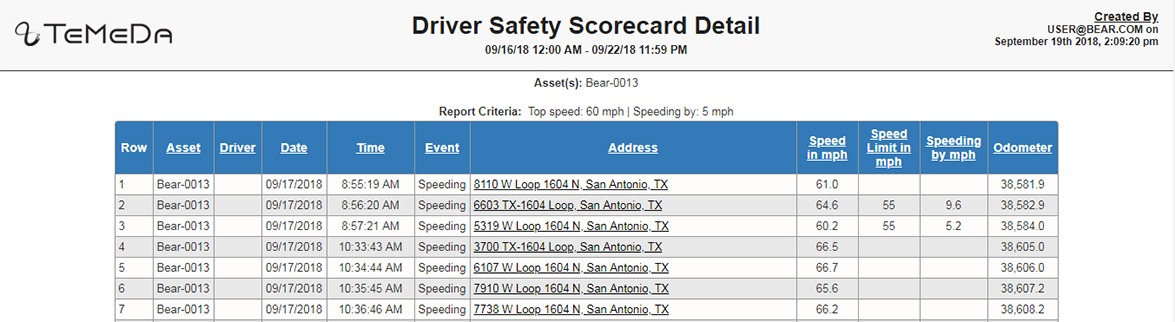
Shows the driver safety event details and scores of each driver.
You can adjust the top speed threshold for speeding events, and the report will total harsh accelerations, braking, and harsh maneuver events.
Engine Hours & Utilization
Asset Utilization By Hour
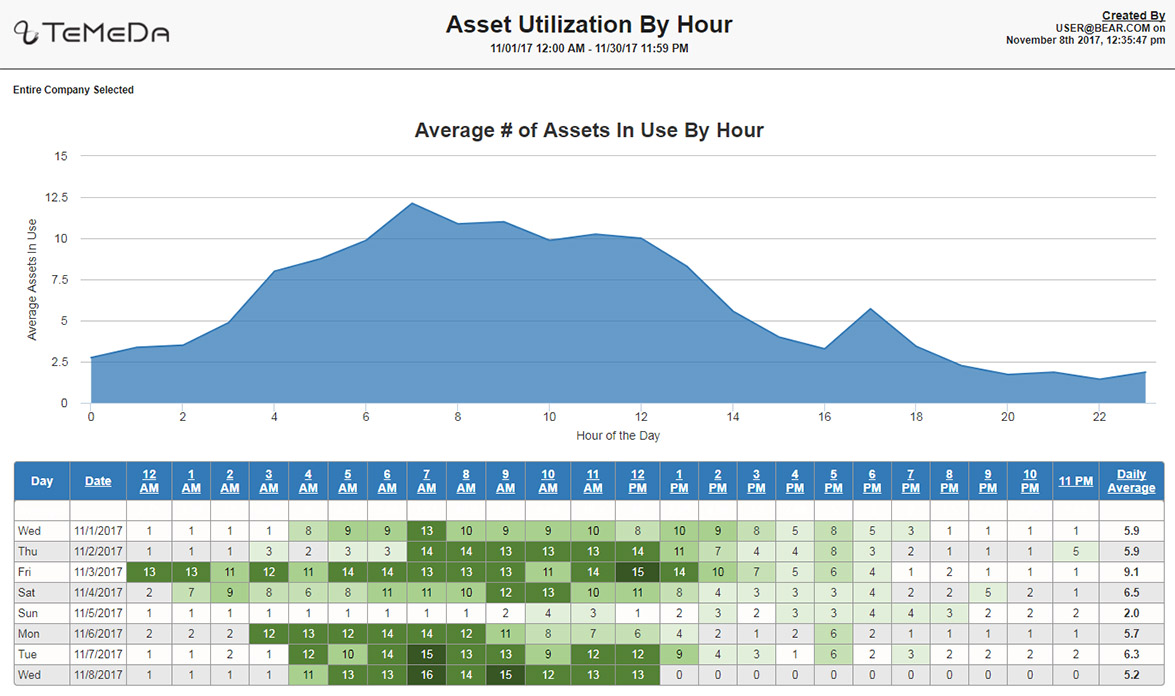
Allows users to analyze how many assets are running per hour per day for a selected timeframe.
The report displays a graphic line chart and 24 hour heat map of the most active hours for your fleet. You can also see the Average # of active Assets per hour and the Daily Average.
Engine Hours By Asset
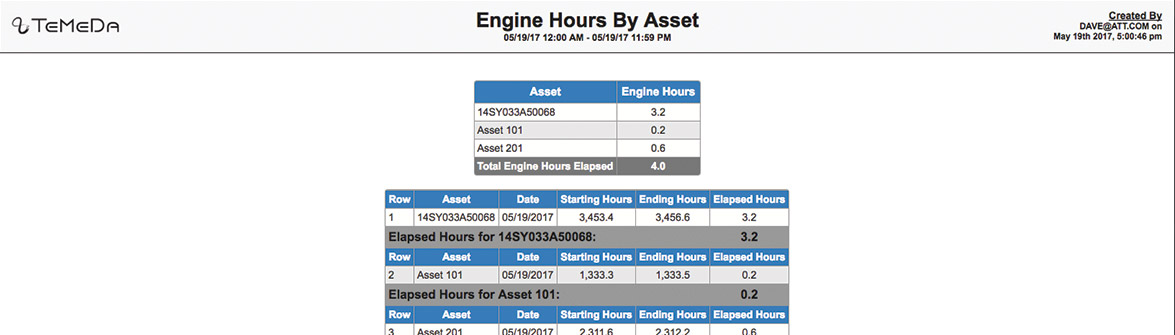
Totals the engine hours for the entered assets over the entered date range.
Details by asset and date are also provided. This report is calculated by the engine hours provided by the GPS device.
Engine Hours By Day
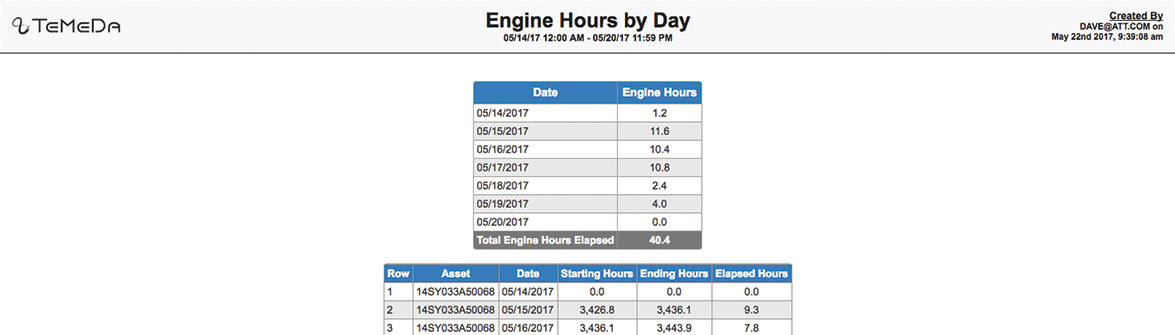
Totals the engine hours for the entered assets over the entered date range.
Details by asset and date are also provided. This report is calculated by the engine hours provided by the GPS device.
Job Site Utilization
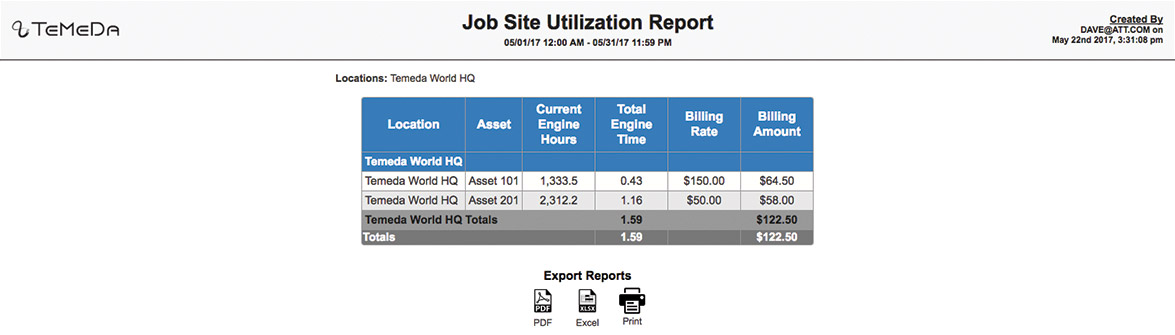
Calculates the total engine hours each asset was in each of the locations selected.
If billing rate is available on the asset, the total billing amount will also be calculated.
Job Site Utilization By Week
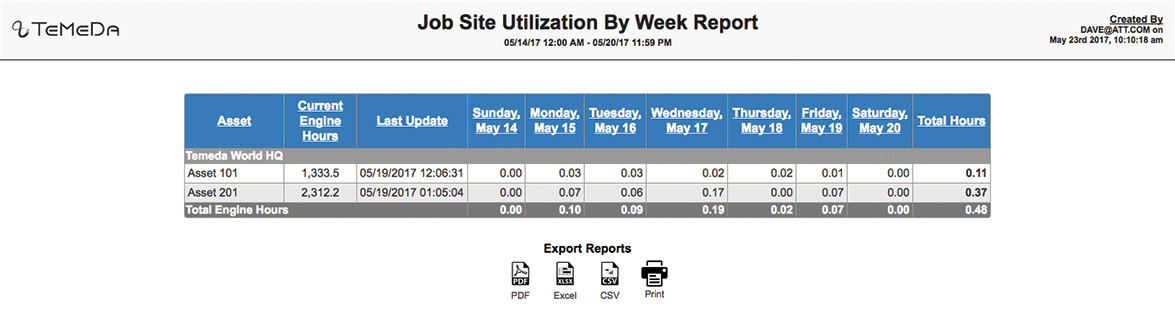
Shows the total engine hours that occurred in a single location selected over the date range entered.
This report totals hours by day and asset and shows current engine hours for each of the assets.
Fuel & Idle
Fuel Economy
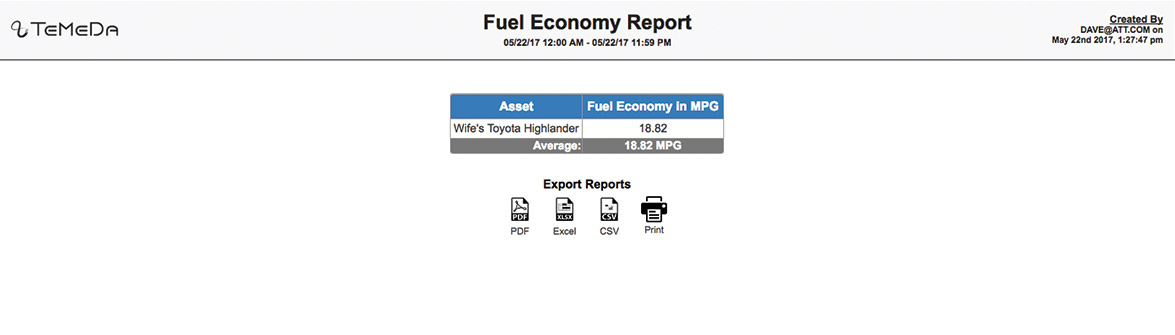
Shows the fuel economy over the date range as computed using Total Fuel Used/Total Distance Traveled for assets that provide the information.
Fuel Usage within Locations (Fuel Tax Credit)
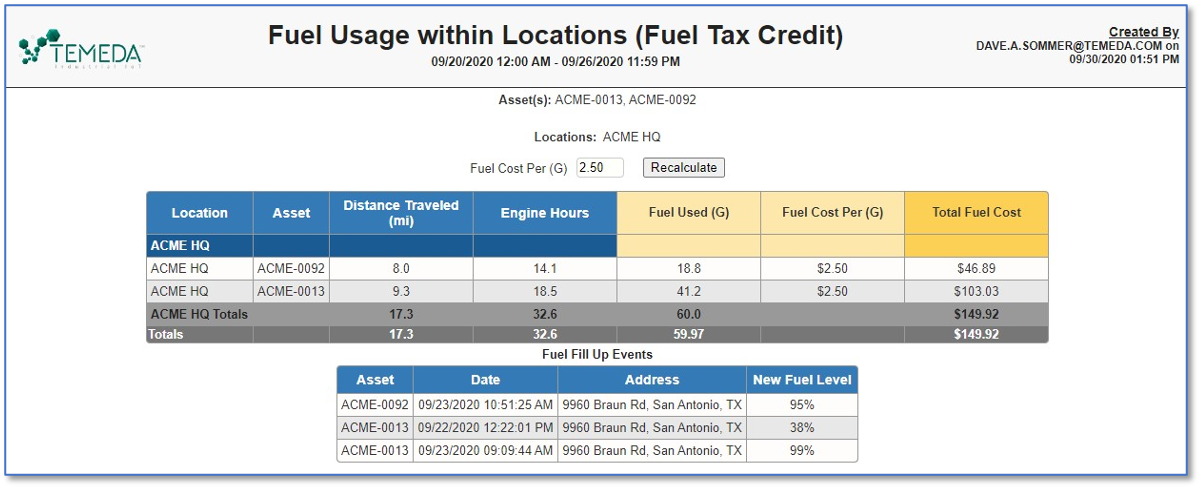
This report has two parts. The top section totals the fuel consumption and fuel cost within geofenced Locations for a selected date range. Engine Hours and Distance are also shown for the specified timeframe. The GPS device must be sending Total Fuel data.
This second section is a log of fuel fill-up events, including the Asset name and the date, time, and address of the fill-up event.
Fuel Usage
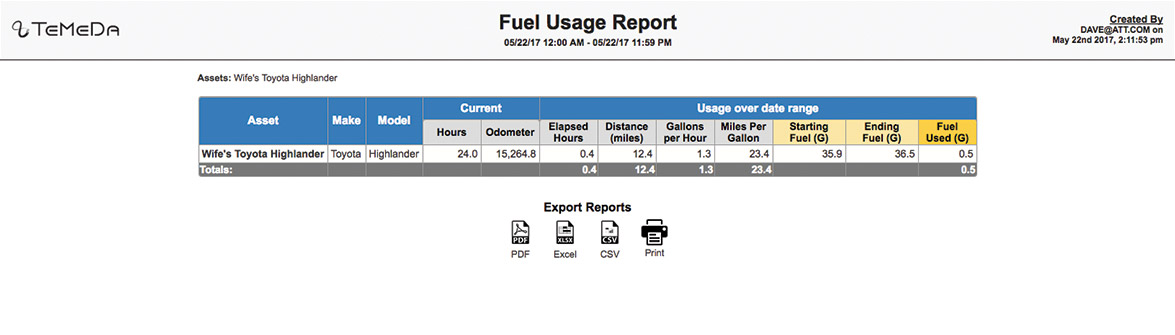
Totals the fuel consumption per Asset for the selected assets over the entered date range.
Engine Hours and Distance are also shown for the selected timeframe. This report is calculated by the total fuel used provided by the GPS device.
Idle by RPM
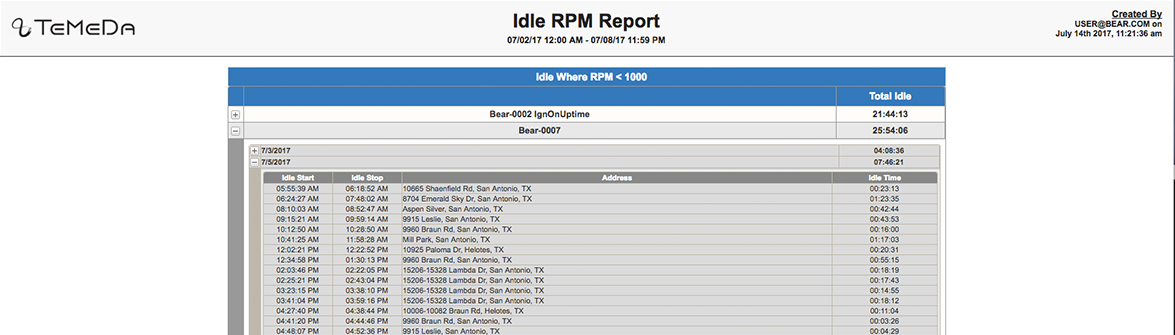
Shows the total idle time for the asset over the date range.
Idle for this report is based on the RPM threshold entered by the user when the report was submitted. Only ignition events and events with RPM are evaluated for this report.
An idle event starts on ignition on if the first RPM point is below the threshold or when a following point drops below the RPM threshold. Idle stops when there is a point above the RPM threshold or on ignition off. You can click to see further breakdown by day and again to see the details with addresses of all the idle events.
Idle Report
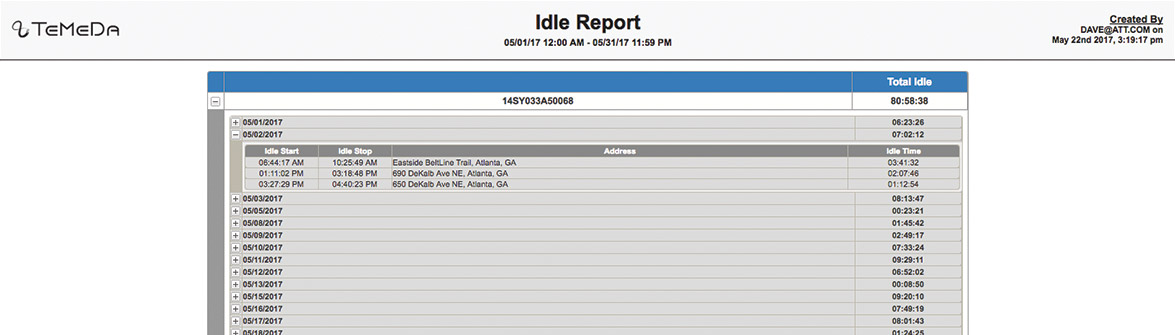
Shows the total idle time for the asset over the date range.
Click to see further breakdown by day, and click again to see the details with addresses of all the idle events.
Maintenance
Check Engine / Diagnostics (DTC)
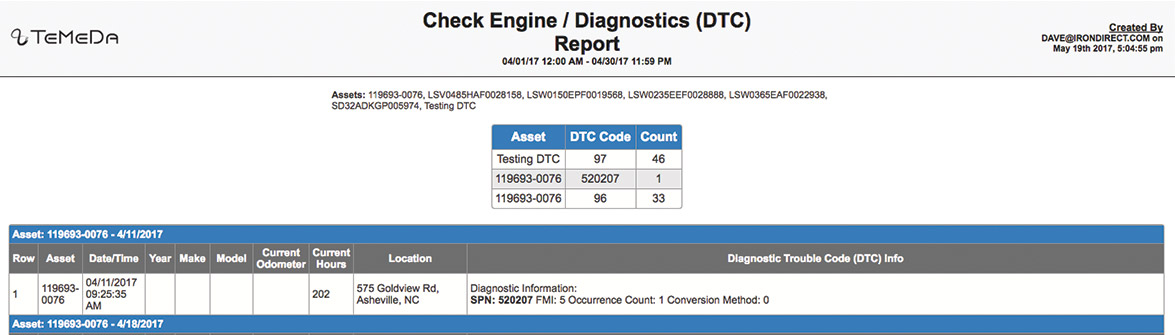
Lists any Diagnostic Trouble Codes found for the assets/group and date range selected. Relevant information is provided if found for the trouble code.
Maintenance Status

Shows the due/overdue status information for the selected assets.
There is no date range on this report; the statuses are current and are color-coded based on the percentages entered on the maintenance plan.
Sensors
Binary Sensors
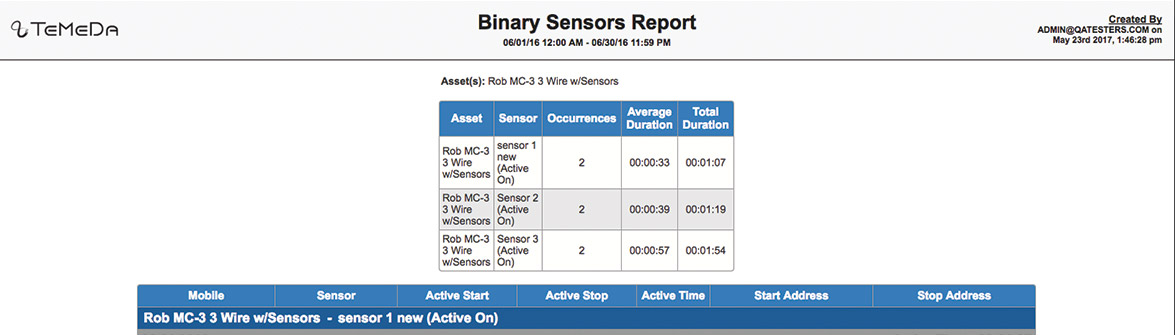
Shows on/off information for the sensors attached to your assets.
Temperature Sensor
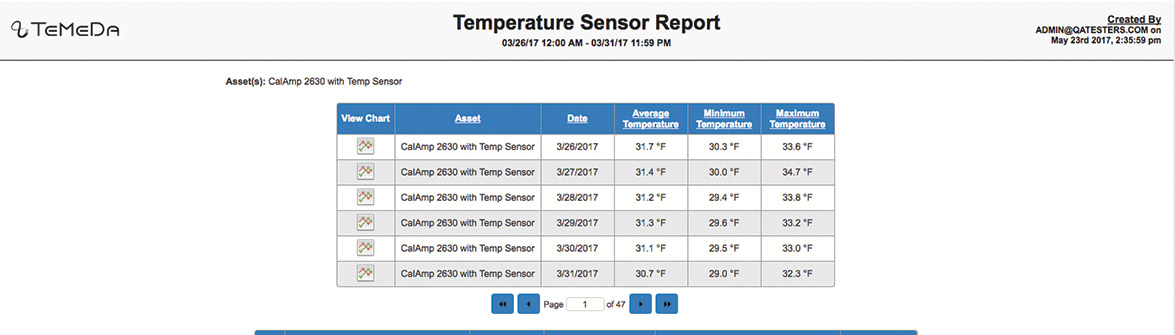
Shows information gathered from temperature sensors attached to the asset, as well as daily charts of the temperature variation.
Miscellaneous
Assets and Drivers

Lists each Asset and the history of Drivers assigned to the asset. The report displays Asset/Driver information for the selected assets.
Group Status
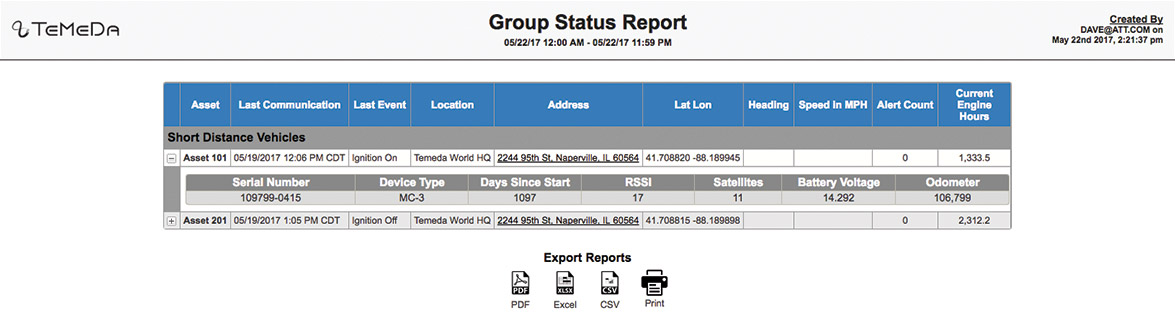
The Group Status report is a ‘point-in-time’ report, displaying the assets in a group or groups and the assets’s current location, status, and speed.
If you click the plus sign next to an asset, you can get more detailed information such as the device serial number, odometer and battery voltage.
Proximity
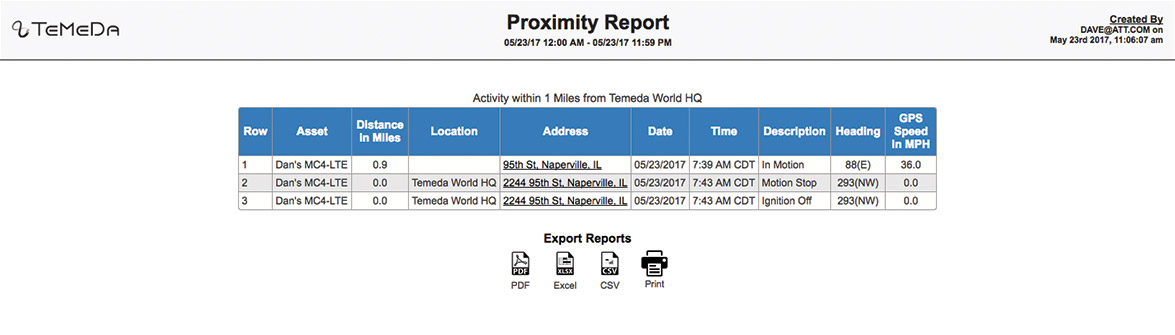
Shows all the events that happened within the selected distance from a location or address.
Lists the description of the event, the location if applicable and the speed if the asset was in motion.