
Alerts are rules or conditions that are applied to Assets. Temeda offers a wide variety of Alert Rules, and an Alert event is created every time an alert condition is met. Alert Events can be configured to generate email notifications, SMS notifications, or webhooks. The Alert Detail Report can be used to summarize Alert Events generated from a single Alert Rule, or it can be used to summarize alert events for the entire account.
- Where are Alert Events found throughout Temeda?
- What are the different types of Alert Rules?
- How are Alert Rules Managed?
Alert Locations
Here is a list of areas in Temeda where Alerts can be seen.
- Alert Events View
- Alert Detail Report
- Fleet Overview Dashboard
- Asset Dashboard
- Accordion Menu
- Asset Pop-Up
- GUT (Global Update Tray)
- Grid
Alert Events View
The Alert Events View is one of two places where all individual alert events can be seen for the entire account, and the other is the Alert Detail Report. Individual Alert Events can be found in the table in this view. The table contains the following information about Alert Events, which can be sorted by clicking on a column header.
- Asset Name
- Time of the Alert Event
- The severity of the Alert Event
- The type of Alert Rule
- The name of the Alert Rule
- The content of the Alert message
- The date the notification was sent if one was generated.
- A shortcut to the Asset Dashboard

The Alert Events View can be found by clicking Alerts > View Alert Events.
The Alert Events View can also be found by clicking the Alert Events button at the top of the Manage Alerts/ Rules window.

Alert Events can be filtered by severity level, timeframe, and by entering text in the Filter Events text bar. The Filter Events text bar can filter Asset names, Alert Names, or content in the Alert Message.

Click the Export Data button to export a CSV file. The file will contain all the Alert Events that fall within the selected filters.

Admins can clear/delete an Alert Event from all views and reports by clicking the Delete Alert Event button in the Action column.

The Alert Detail report can summarize individual Alert Rules, all Alert Events of a specific type, or all Alert Events in the account. Often, managers prefer to receive a report summarizing all Alert Events in place of receiving an SMS or Email notification every time an Alert Event occurs.
How to run the Alert Detail Report
Here are instructions to run the Alert Detail Report.
- Hover your mouse over the Reports button and then click on Run a Report.
- Select Alert Detail from the Report Name dropdown menu.
- Select the Assets that you want to be summarized in the report.
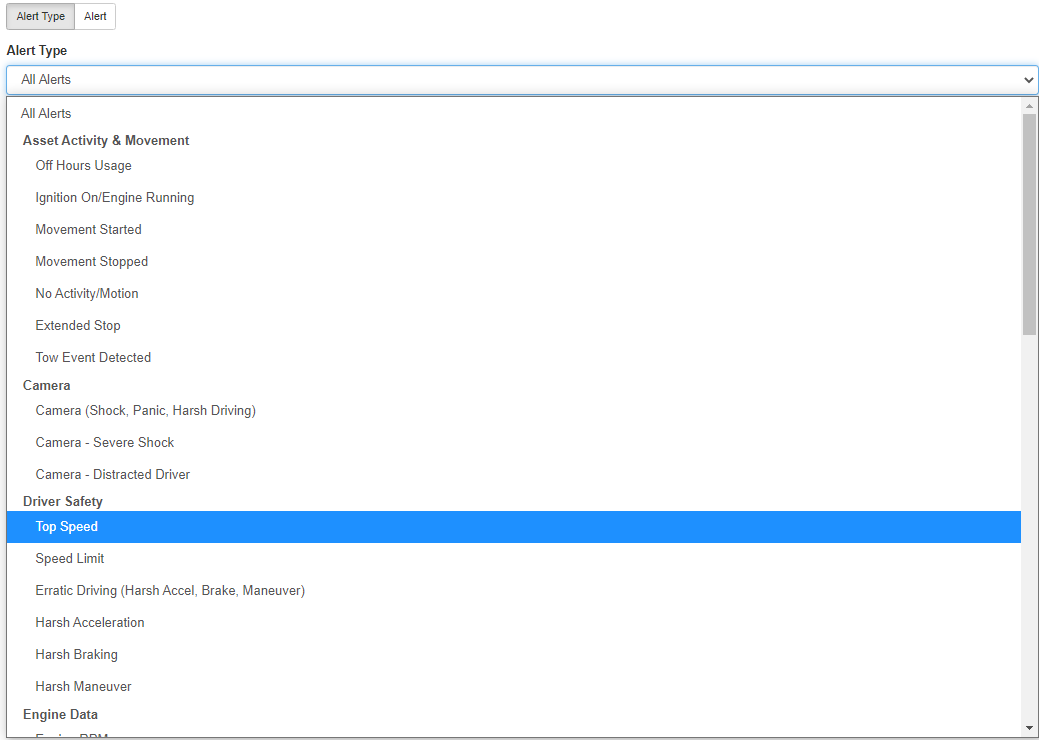
- The report summarizes all Alert Events by default, but a user can filter by Alert Rule type…
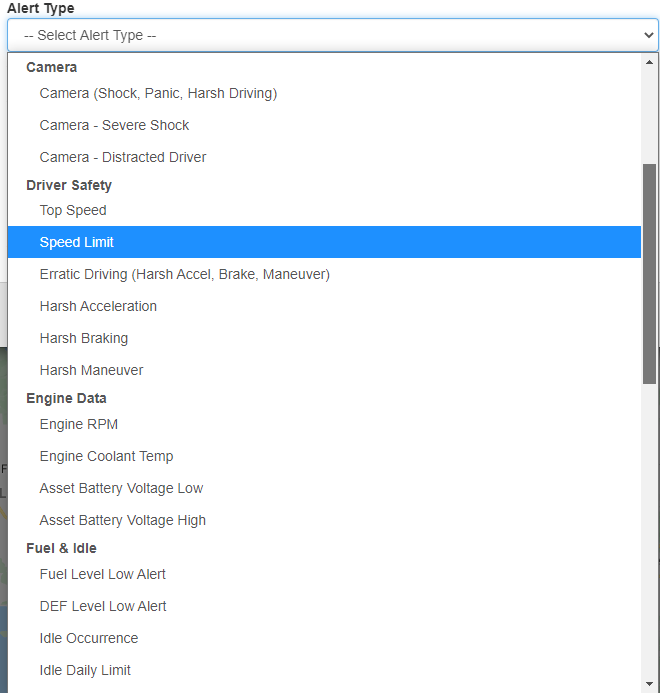
…or by a specific Alert Rule.

- Select the timeframe.
- Click Run Report.
How to schedule the Alert Detail Report
- Hover your mouse over the Reports button and then click on Schedule a Report.
- Select Alert Detail from the Report Name dropdown menu.
- Select the Assets that you want to be summarized in the report.
- The report summarizes all Alert Events by default, but Alert Events can be filtered by Alert Rule Type or a specific Alert Rule.
- Select the file format.
- Enter the email (s) that should receive the report.
- Enter the name of the report. The name will be used in the subject line of the email that contains the Alert Detail Report.
- Select the Frequency.
- Select whether or not the report should be sent on weekend days in the Occurrence section.
- Select the start date for when the reports will begin being sent.
- If necessary, an End Date or Count can be selected to stop the report from being sent after a project is scheduled to end.
Alert Locations
Fleet Overview Dashboard
The Fleet Overview Dashboard has a view dedicated to Alerts. This view provides a breakdown of all alert events triggered within your organization. This powerful tool allows users to gauge business performance, identify key trends, identify minor issues before they become significant issues, enhance accountability, improve safety, and predict future performance.

- Total Alerts – The number of alerts generated.
- Critical Alerts – The number of critical, high-severity alerts generated. The severity level is selected when the Alert Rule is created.
- Driver Safety Alerts – The number of driver safety alerts generated (e.g., Speed Limit, Speed Threshold, and Harsh Maneuver).
- Idle Alerts – The number of idle alerts generated (e.g., Idle Occurrence and Idle Daily Limit).

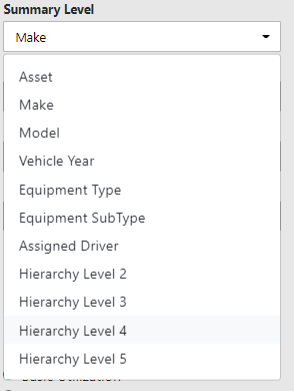
- Alerts Triggered by Summary Level – This chart allows you to compare almost anything you can think of side-by-side. This capability enables users to find outliers in performance. Shown below are the entities that can be compared side-by-side, as well as Groups and Projects.
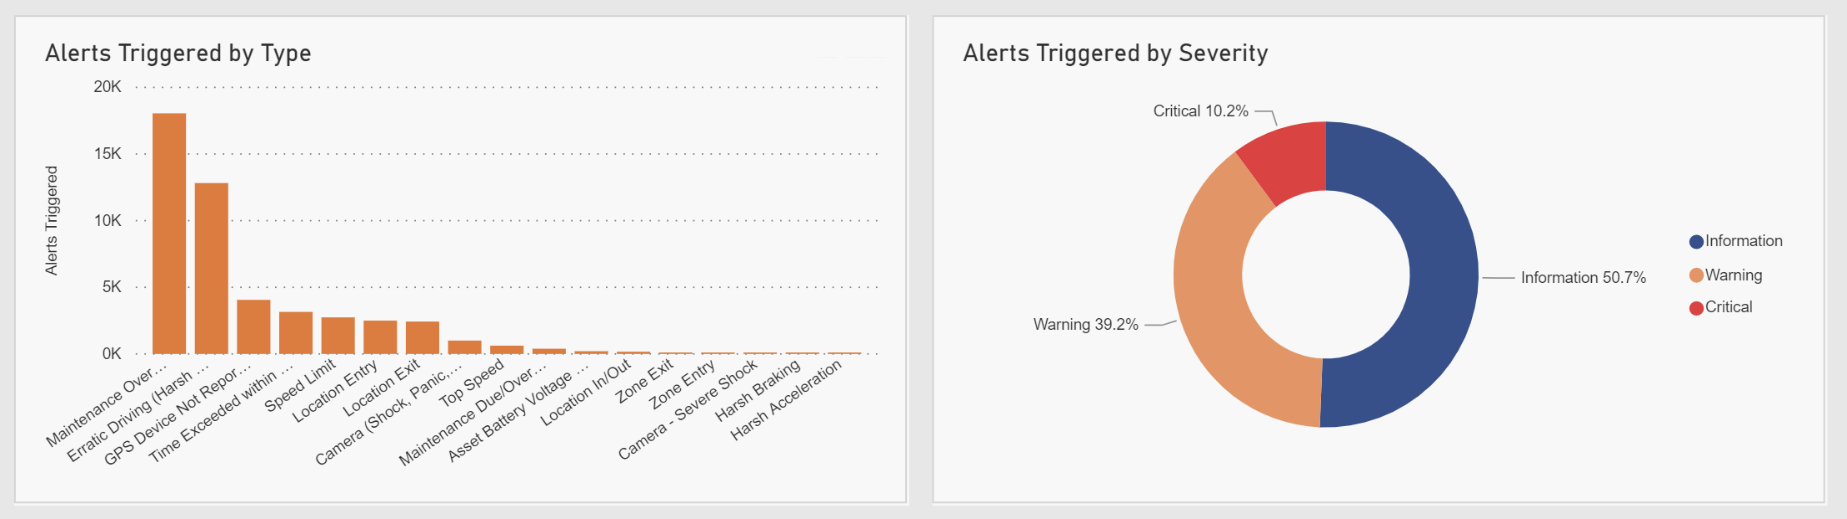
- Alerts Triggered by Type – Alerts Triggered by Alert Rule Type.
- Alerts Triggered by Severity – Alerts Triggered by Alert Severity level. The severity level is selected when an Alert Rule is created.
- Alert Summary Table – This Table displays a count of Alert Events broken out by Alert Rule Type.
Asset Dashboard
The Asset Dashboard is an easy way to see all the Alert Events related to a specific Asset.

If an Asset has triggered an Alert Event over the last twenty-four hours, a triangle will appear in the bottom left corner in the Asset’s box in the Accordion menu. The number to the triangle’s right indicates the number of Alerts the Asset generated over the preceding twenty-four hours. Clicking on the triangle will take you to the Alert section of the Asset Dashboard.

The Asset Pop-Up will have an Alerts tab if the Asset has generated an alert over the last twenty-four hours. The number to the right of the word “Alert” indicates the number of Alert Events the Asset has caused over that period. The content of the alerts can be viewed by clicking on the Alert tab.

The Global Update Tray, or GUT for short, displays the total number of Alert Events over the last twenty-four hours. Clicking the word ALERTS will display a list of all Alert Rule types that have triggered an alert event during the previous twenty-four hours and the number of occurrences of that type during that time.
The GUT can be used to filter by an Alert Rule type by clicking on the Alert Rule type. Clicking an Alert Rule type will cause the Assets to filter to only Assets that have had an alert of that type in the Map, Accordion Menu, and GRID.

All accounts have a column in their Grid view with a count of the number of an Asset’s Alert Occurrences over the last twenty-four hours.

Note: When setting up Alert Rules, there are two things to keep in mind.
- Alert content will be in the time zone and units of measure being used by the User setting up the Alert.
- Alert Rules are disregarded when the User that created the Alert is deleted.
To add, update, enable, disable, or delete alerts, click Alerts > Manage Alerts/ Rules.
Add an Alert Rule
- Hover your mouse over Alerts and click Manage Alerts/ Rules.
- To add a new alert Rule, Click the +Add Alert button. A new window will open.

- Keep the Enabled box check-marked.
- Non-Admin Users Can View
- If this box is check-marked, all users assigned to the Hierarchy account will see the Alert Events generated by the Alert Rule.
- If a Non-Admin leaves this box unchecked, only the Non-Admin creating the Alert Rule, Restricted Admins, and Admins assigned to the hierarchy account will see the associated Alert Events.
- If a Restricted Admin or Admin leaves this box unchecked, only other Admins and Restricted Admins assigned to the same hierarchy account will see the associated Alert Events.
- Enter the Alert Name. The name will be used in the following areas of Temeda:
- Alert Detail Report
- Alert Events View
- Asset Pop-up
- Asset Dashboard
- Select the Alert Type from the dropdown menu. Depending on which Alert Type you chose, the fields on the window will change.
- Applies To: Select the Assets that the Alert Rule will be used for.
- When creating alerts rules, we recommend using ‘Groups’ or ‘Entire Company’ to associate your assets to the Alert. If practical, use the ‘Entire Company’ option when possible. If a Group is selected, whenever a new Asset is added to the Group, they are automatically included in that Group’s alerts.
- If Groups or Individual Assets is selected, another box will appear directly beneath where the Assets or Groups can be chosen by checking the box to the name’s left.
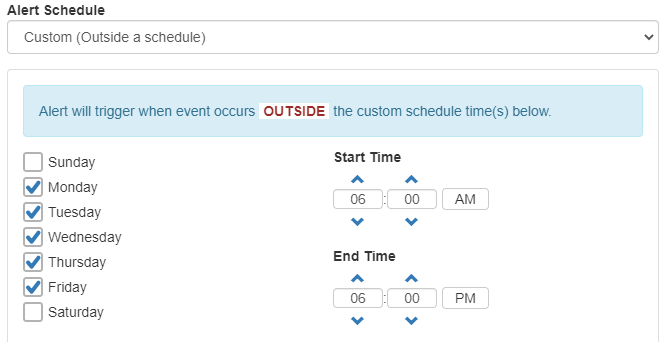
- Alert Schedule: The Alert Schedule sets when the Alert Rule wil be active. The three options are 24×7, and Custom Inside or Outside a Schedule.
- 24×7: An Alert Event can be created any time, day or night.
- Custom (Inside a Schedule): An Alert Event will be created only during the selected days and times.
- Custom (Outside a Schedule): An Alert Event will be created only outside the selected days and times.
- The Alert Frequency is the minimum amount of time before an Asset can trigger an Alert Event for the same Alert Rule.
- The Notification Frequency is the minimum amount of time before an Alert Event can trigger a notification for the same Asset and Alert Rule.
- Enter the Alert Subject. Every Alert Rule type has a default Alert Subject that can be customized. Alert Tokens automatically fill Asset data into an Alert’s subject or content fields. The easiest way to insert a Token is to use the dropdown box above the Alert Subject. The Alert Subject is limited to 250 characters. The Alert Subject will be visible in the following areas:
- If an email notification is configured, the Alert Subject will be used as the subject line.
- If a text message notification is configured, the Alert Subject will be the text message.
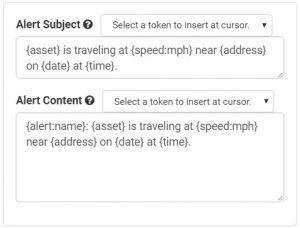
- Enter Alert Content. Every Alert Rule type has default Alert Content that can be customized. You may use tokens in Alert Content to include data from the Asset. Alert Content is limited to 4000 characters. Alert Content is not used in Text message notifications. Alert Content will be visible in the following areas:
- If an email notification is configured, Alert Content will be used as the email body.
- Alert Events View
- Asset Dashboard
- Alert Detail report
- Asset Pop Up
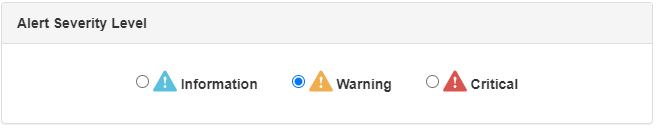
- Select the Alert Severity level. The Fleet Overview Dashboard has multiple references to the Alert Severity level, and the Severity Level can be used as a filtering option in the Alert Events view.
- Set up Email or Text Message notifications using the Contact section. This step is optional, as many users prefer not to receive an email or text message every time an alert event is triggered. A Contact can be one person’s email and phone number, or an entire contact list full of email addresses and phone numbers.
- Use the dropdown menu to check for a Contact that has already been created before adding a new one.
- Click the Add button in the Contact box if one has not yet been created.
- Enter a Contact Name. The Contact Name is the name given to the distribution list. The Contact will be added for future use from the dropdown menu in the Contact section when setting up an alert rule.
- Enter the email(s). Separate multiple emails with a comma, or use a company distribution list.
- Enter the text message phone number(s).
- US Phone numbers: Enter ten digits with no spaces and separate multiple phone numbers with a comma.
- Non-US Phone numbers: Enter country code and numbers only, no spaces. Separate multiple phone numbers with a comma.
- Admins can add, delete, or update Contacts from the Account Contact List window. To navigate to the Account Contact List window, follow the directions below.
- Hover your mouse over Admin.
- Hover your mouse over Account.
- Click on Contacts.
- Select Alert Only, Alert and Webhook, or Webhook Only.
- Webhooks allow external services to be notified when Alert Events happen. Each time the specified alert condition is triggered, we’ll send a POST of JSON payload data to the URL you provide. The data will contain information about the Alert Event, the Asset, and any tokens you include in the Alert Content. Webhooks can be used by a company’s development team to automate tasks related to an Alert Event. Customers can save these Webhook messages for use within another application, such as a Data Warehouse. The Data Warehouse could then be used to create custom
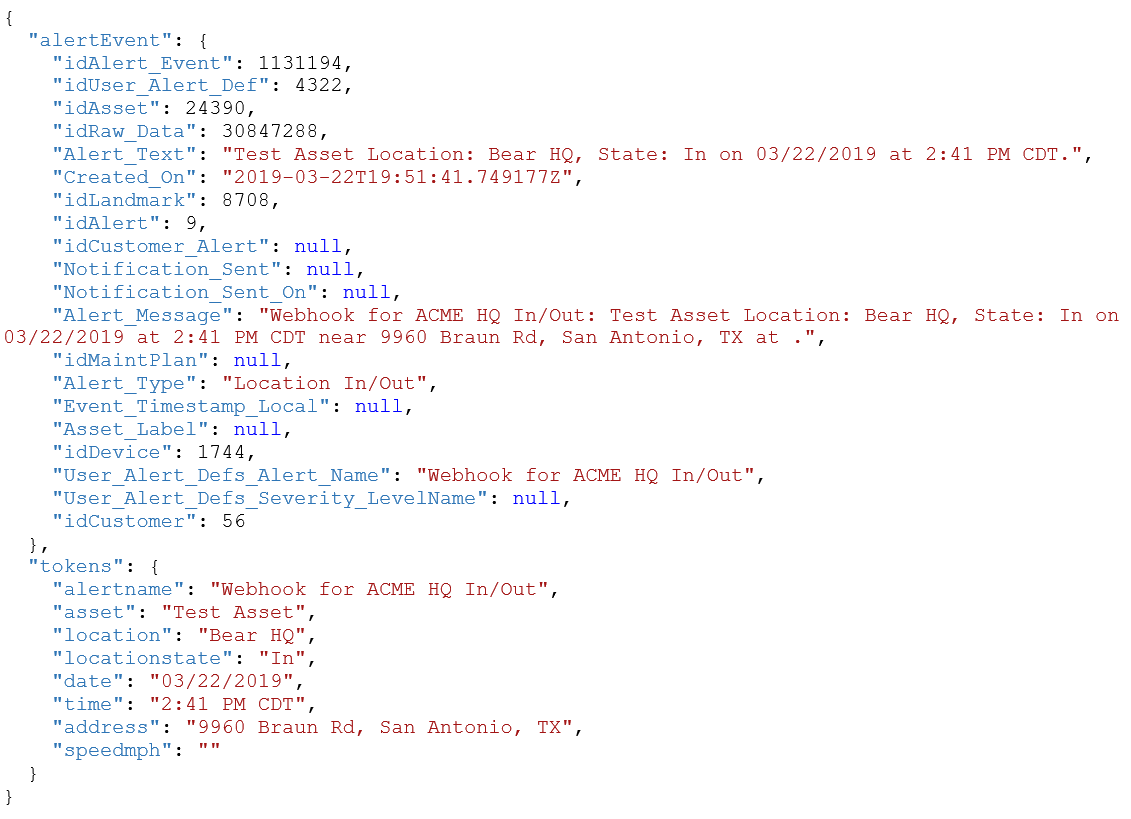 reports or dashboards. Here is an example webhook JSON message:
- Webhooks allow external services to be notified when Alert Events happen. Each time the specified alert condition is triggered, we’ll send a POST of JSON payload data to the URL you provide. The data will contain information about the Alert Event, the Asset, and any tokens you include in the Alert Content. Webhooks can be used by a company’s development team to automate tasks related to an Alert Event. Customers can save these Webhook messages for use within another application, such as a Data Warehouse. The Data Warehouse could then be used to create custom
Update an Alert Rule
To update an existing Alert Rule, click the pencil icon to Alert Rule’s right, in the Action column.

To delete an existing Alert Rule, click the icon to Alert Rule’s right, in the Action column. Next, confirm that you wish to delete the Alert Rule.
Enable or Disable an Alert Rule
To enable or disable an alert rule, check or uncheck the box in the Enabled column. Alert Rules can be filtered by Enabled or Disabled from this view.
Export Alert Rules
To export a CSV file of Alert Rules, click the Export Data Button.
Types of Alert Rules
Asset Activity & Movement
Off Hours Usage
This Alert will trigger when an asset sends an “In Motion” or “Running” event during a customizable “Off Hours” schedule.
Ignition On/Engine Running
This Alert will trigger when an asset sends an “Ignition On” or “Running” event during a customizable schedule.
Movement Started
This Alert is triggered whenever an asset sends a “Motion Start” event.
Movement Stopped
This Alert is triggered whenever an asset sends a “Motion Stop” event.
No Activity/Motion
This Alert is triggered if an asset has no movement during the duration of a customizable schedule.
Extended Stop
This Alert is triggered if an asset hasn’t moved for a set amount of time.
Tow Event Detected
This Alert is triggered when an asset sends a “Tow Event” message.
Camera
Camera (Shock, Panic, Harsh Driving)
This Alert is triggered when a camera device sends a Shock event, Panic button event, or Harsh Driving Event.
Camera – Severe Shock
This Alert is triggered when a video telematics product meets the Severe Shock threshold defined by the fleet admin.
Camera – Distracted Driver
This Alert is triggered when a video telematics product detects a distracted driver event.
Driver Safety
Top Speed
This Alert is triggered whenever an asset exceeds a customizable Top Speed threshold.
Speed Limit
This Alert is triggered when an asset exceeds the speed limit of the street by a customizable amount.
Erratic Driving (Hard Accel, Brake, Maneuver)
This Alert is triggered when an asset performs a harsh maneuver, harsh brake, or harsh acceleration. Please contact our customer support team for help programming your telematics devices.
Harsh Acceleration
This Alert is triggered when an asset performs a harsh acceleration. Please contact our customer support team for help programming your telematics devices.
Harsh Braking
This Alert is triggered when an asset performs a hard brake. Please contact our customer support team for help programming your telematics devices.
Harsh Maneuver
This Alert is triggered when an asset performs a sharp maneuver. Please contact our customer support team for help programming your telematics devices.
Engine Data
Engine RPM
This Alert is triggered when an asset’s RPM exceeds a customizable threshold.
Engine Coolant Temp
This Alert is triggered when an asset’s coolant temperature exceeds a customizable threshold.
Asset Battery Voltage Low
This Alert is triggered when an asset’s battery drops below a customizable threshold.
Asset Battery Voltage High
This Alert is triggered when an asset’s battery voltage exceeds a customizable threshold.
Fuel & Idle
Fuel Level Low
This Alert is triggered when an asset’s fuel level drops below a customizable threshold.
Idle Occurrence
This Alert is triggered when an asset’s engine runs in a stationary position for longer than a customizable time limit. The device must be programmed to send Idle Events. Please contact the Temeda Customer support team for assistance with programming your devices to send idle events.
Idle Daily Limit
This Alert is triggered after the cumulative amount of time an asset spends not in motion exceeds a customizable threshold for the day.
GPS/ Telematics Device
GPS Device Battery % Low
This Alert is triggered when a Telematics device’s internal battery falls below a customizable threshold.
GPS Device Battery Voltage Low
This Alert is triggered when the voltage of a device’s battery falls below a customizable threshold.
GPS Device Temp Sensor Low
This Alert is triggered when an MC-1’s temperature sensor detects a temperature below a customizable threshold.
GPS Device Temp Sensor High
This Alert is triggered when an MC-1’s temperature sensor detects a temperature above a customizable threshold.
GPS Device Not Reporting
This Alert is triggered when a device stops sending messages for a customizable amount of time.
Power On
This Alert is triggered when a telematics device sends a “Power On” message.
Power Loss
This Alert is triggered when a telematics device sends a “Power Loss” message.
Locations & Zones
A note about locations and zones: A Location or Zone is a geofence created using the Temeda application.
Location Entry
This Alert is triggered when an asset enters a Location.
Location Exit
This Alert is triggered when an asset exits a Location.
Location In/Out
This Alert is triggered when an asset exits or enters a Location.
Location Stop
This Alert is triggered when an asset sends a motion stop event inside a Location.
Time Exceeded within Location(s)
This Alert is triggered when an asset exceeds a customizable threshold for the amount of time in a Location.
Time Exceeded & No Motion Outside Location(s)
This Alert is triggered when an asset stops outside of a location for longer than a configurable time-limit.
Zone Entry
This Alert is triggered when an asset enters a zone.
Zone Exit
This Alert is triggered when an asset exits a zone.
Zone Stop
This Alert is triggered when an asset sends a “Motion Stop” Event in a zone.
Maintenance
Maintenance Due/Overdue
This Alert is triggered when maintenance is due and when it is overdue.
Maintenance Due
This Alert is triggered when maintenance is due.
Maintenance Overdue
This Alert is triggered when maintenance is overdue.
Check Engine/ Diagnostic (DTC)
This Alert is triggered when a device detects a diagnostic trouble code is active.
Failed Inspection
The Asset Failed Inspection Alert is triggered when an asset fails an Inspection.
Sensors
Digital Input 1 Active
This alert is triggered when an MC-4E’s Digital Input has sensed a voltage level change
- 0.0 – 1.5 VDC = Inactive
- 3.5 – 32 VDC = Active
Sensor Active
This Alert is triggered when a binary sensor’s circuit closes.
Temperature Sensor High
This Alert is triggered when a CalAmp’s temperature sensor detects a temperature above a customizable threshold.
Temperature Sensor Low
This Alert is triggered when a CalAmp’s temperature sensor detects a temperature below a customizable threshol